
Financial Performance Analytics Dashboard: Transforming Financial Data into Business Insights
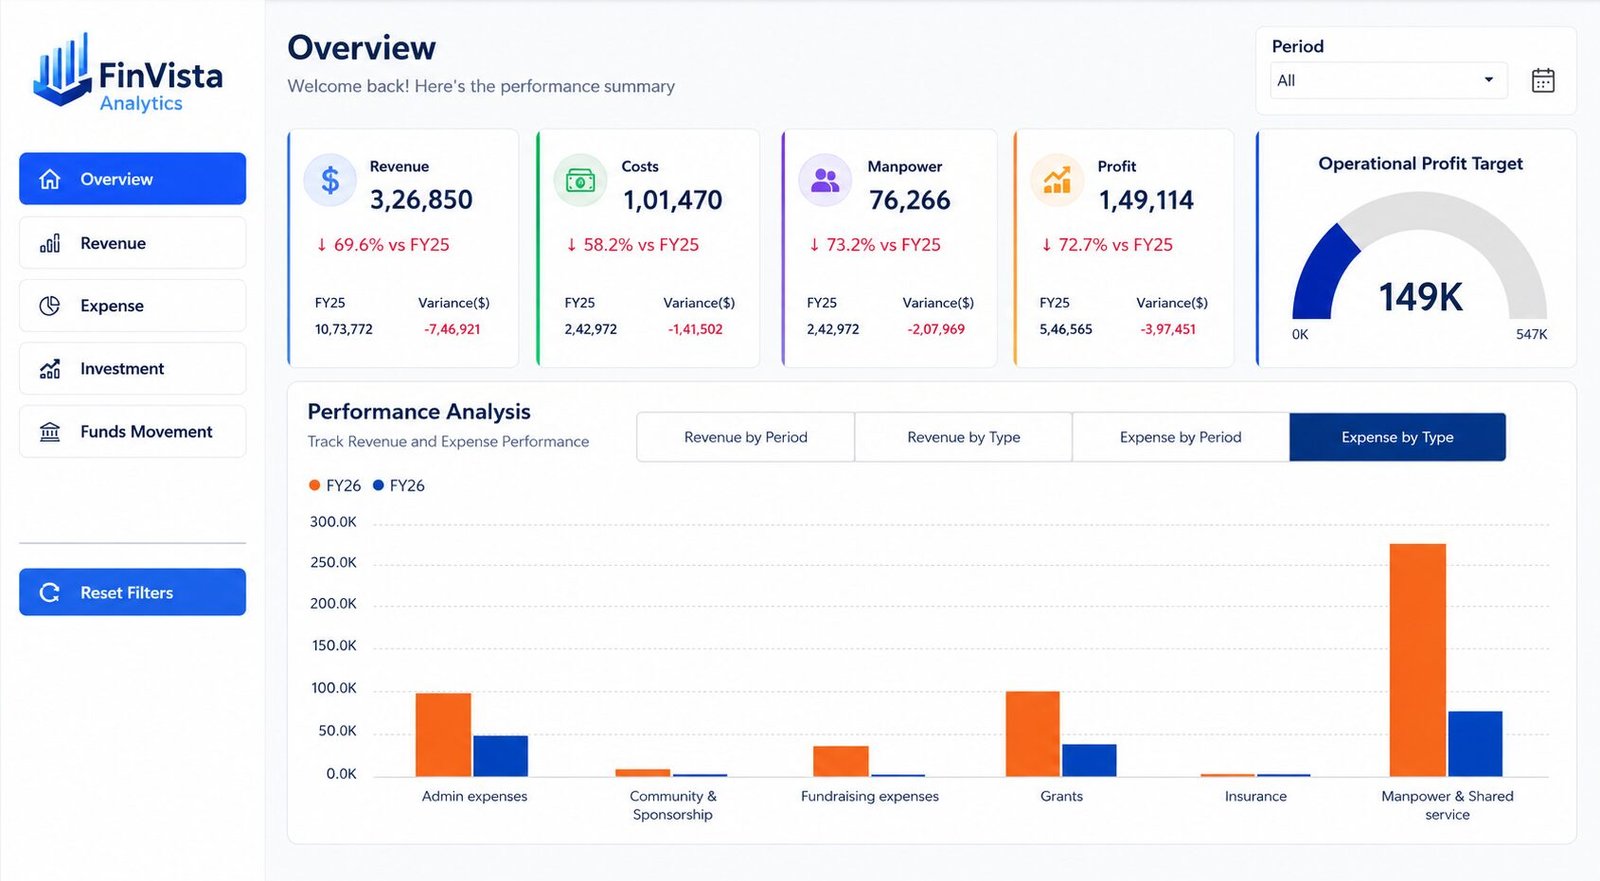
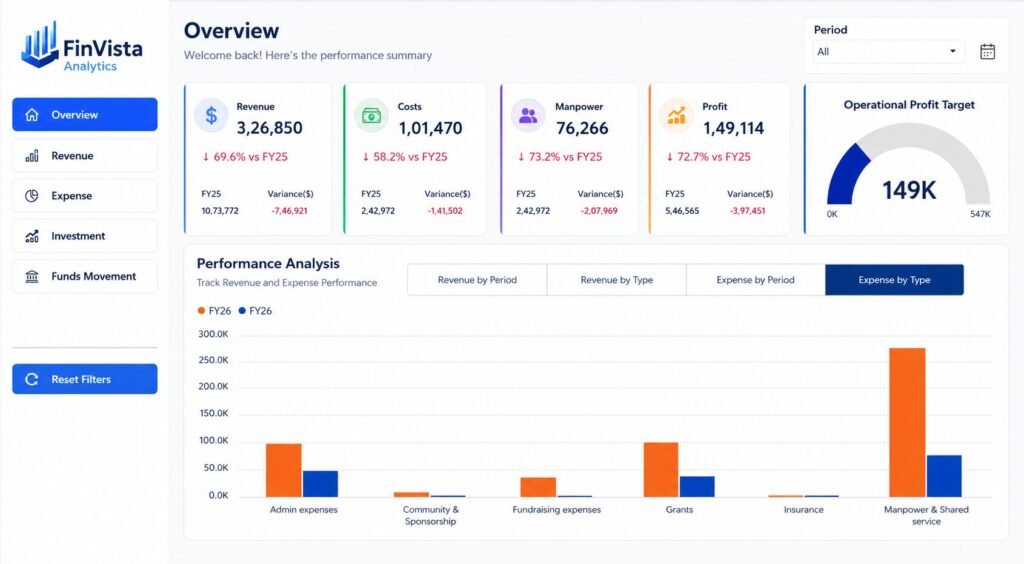
Every organization generates financial data every day. Revenue, expenses, investments, operational costs, and profitability all contribute to understanding business performance. However, when this information is scattered across multiple spreadsheets or accounting systems, identifying meaningful insights becomes both time-consuming and challenging.
A well-designed Financial Performance Analytics Dashboard solves this problem by converting raw financial data into interactive visual reports that support faster and more informed decision-making.
A Complete View of Financial Performance
Instead of reviewing multiple reports individually, stakeholders can monitor key financial indicators from a single dashboard. Important metrics such as Revenue, Expenses, Profit, Operational Costs, and Investment Performance are displayed through KPI cards, trend charts, and interactive visuals.
With dynamic filters, users can analyze data by financial year, reporting period, or specific business category, making it easier to understand where the organization is performing well and where improvements are needed.
Understanding Revenue Trends
Revenue analysis is more than tracking income. It helps answer important business questions:
- Which revenue source contributes the most?
- How does this year’s performance compare with previous years?
- Are there seasonal trends affecting revenue?
- Which categories are growing or declining?
Interactive visualizations allow users to drill into individual revenue streams and identify opportunities for growth.
Monitoring Expenses Effectively
Controlling expenses is equally important as increasing revenue.
The dashboard provides category-wise expense analysis, monthly spending trends, and year-over-year comparisons, helping finance teams identify unusual spending patterns and monitor operational efficiency.
Rather than searching through hundreds of transactions, decision-makers can quickly identify areas requiring attention.
Investment Performance at a Glance
Organizations managing investment portfolios require continuous monitoring of returns and asset allocation.
The Investment Analysis section presents portfolio value, annualized returns, interest income, and investment distribution through intuitive charts, enabling management to evaluate investment performance with confidence.
Interactive Reporting for Better Decisions
One of the biggest advantages of Business Intelligence dashboards is interactivity.
Instead of static reports, users can:
- Filter data dynamically
- Compare financial years
- Drill into specific categories
- Analyze monthly trends
- Monitor performance against targets
This level of flexibility enables faster analysis without manually preparing multiple reports.
Why Business Intelligence Matters
Financial reporting is no longer just about presenting numbers. Modern organizations require reports that explain what happened, why it happened, and where attention is needed.
By combining data modeling, DAX calculations, and interactive visualizations, a Financial Performance Analytics Dashboard transforms complex financial information into actionable business insights.
Whether used by finance teams, management, educational institutions, or non-profit organizations, Business Intelligence helps organizations make data-driven decisions with greater confidence.